Measure results
Close the loop between campaign performance and actual marketing results

Marketing CFOs will love
Cardlytics’ campaign reporting is the gold standard
With insight into bank transaction data, we report our exact impact on sales.
There is no need to estimate performance. These are real purchases, made by real people who saw ads in our platform.
Also important, we report on both online and in-store sales. This enables marketers to accurately track ROI regardless of where customers decide to buy.

Measure impact, not just sales
We help marketers understand the effectiveness of every dollar they spend on our platform. Commonly requested post-campaign reports include:

Quantify sales lift and incremental return
Track whether customers continue to buy

Measure the impact on market share
Test vs. Control
We’ve set up a rigorous test vs. control process to answer three questions every marketer wants to know:
Through our partnerships with top banks in the US and UK, we see over $4.1T in consumer spend. We use this data to evaluate customer purchases, and accurately measure a campaign’s true incremental sales impact.
Access to third-party measurement through Nielsen
Nielsen Sales Lift Measurement calculates and reports the incremental sales lift of Cardlytics campaigns.
Long-Term Value
Long-Term Value reporting sheds light on campaign impact beyond the initial flight.
We look at the purchase patterns of people who converted from the original campaign to measure their continued loyalty to the marketer’s brand – specifically, how many more times they purchase and how much they spend.
Share Shift
Customers have seen the ad and made a purchase. But are marketers actually gaining share from competitors?
With Share Shift analysis, we help brands understand how their customers’ behavior is changing in their category, and if they’re picking up share from their competitive set.
“Cardlytics’ unique targeting capabilities ensure we can acquire new customers and redirect competitive spend to Marriott. The customer experience means that there is no perception of discounting for our brand.”
Lauren Profeta
Portfolio Partnerships Manager, Europe, Marriott Hotels

IDENTIFY OPPORTUNITY
Connect the dots with Purchase Intelligence
Insights into bank transaction data power Cardlytics campaigns from start to finish. Beyond helping marketers measure performance, we also use purchase intelligence to identify the best prospects and target ads on our platform.
Learn more about finding and reaching the right audienceREACH REAL PEOPLE
Create a tipping point to win the next sale
Our native ad platform in banks’ digital channels reaches consumers as they manage where they’ll spend and save. When customers weigh whether to buy from one store or another, relevant, targeted offers can change their purchase decisions.
Learn more about our ad platform
Research & Insights
View all


What UK travellers did in the first five months of 2026 — and what the data predicts for the rest of the year.
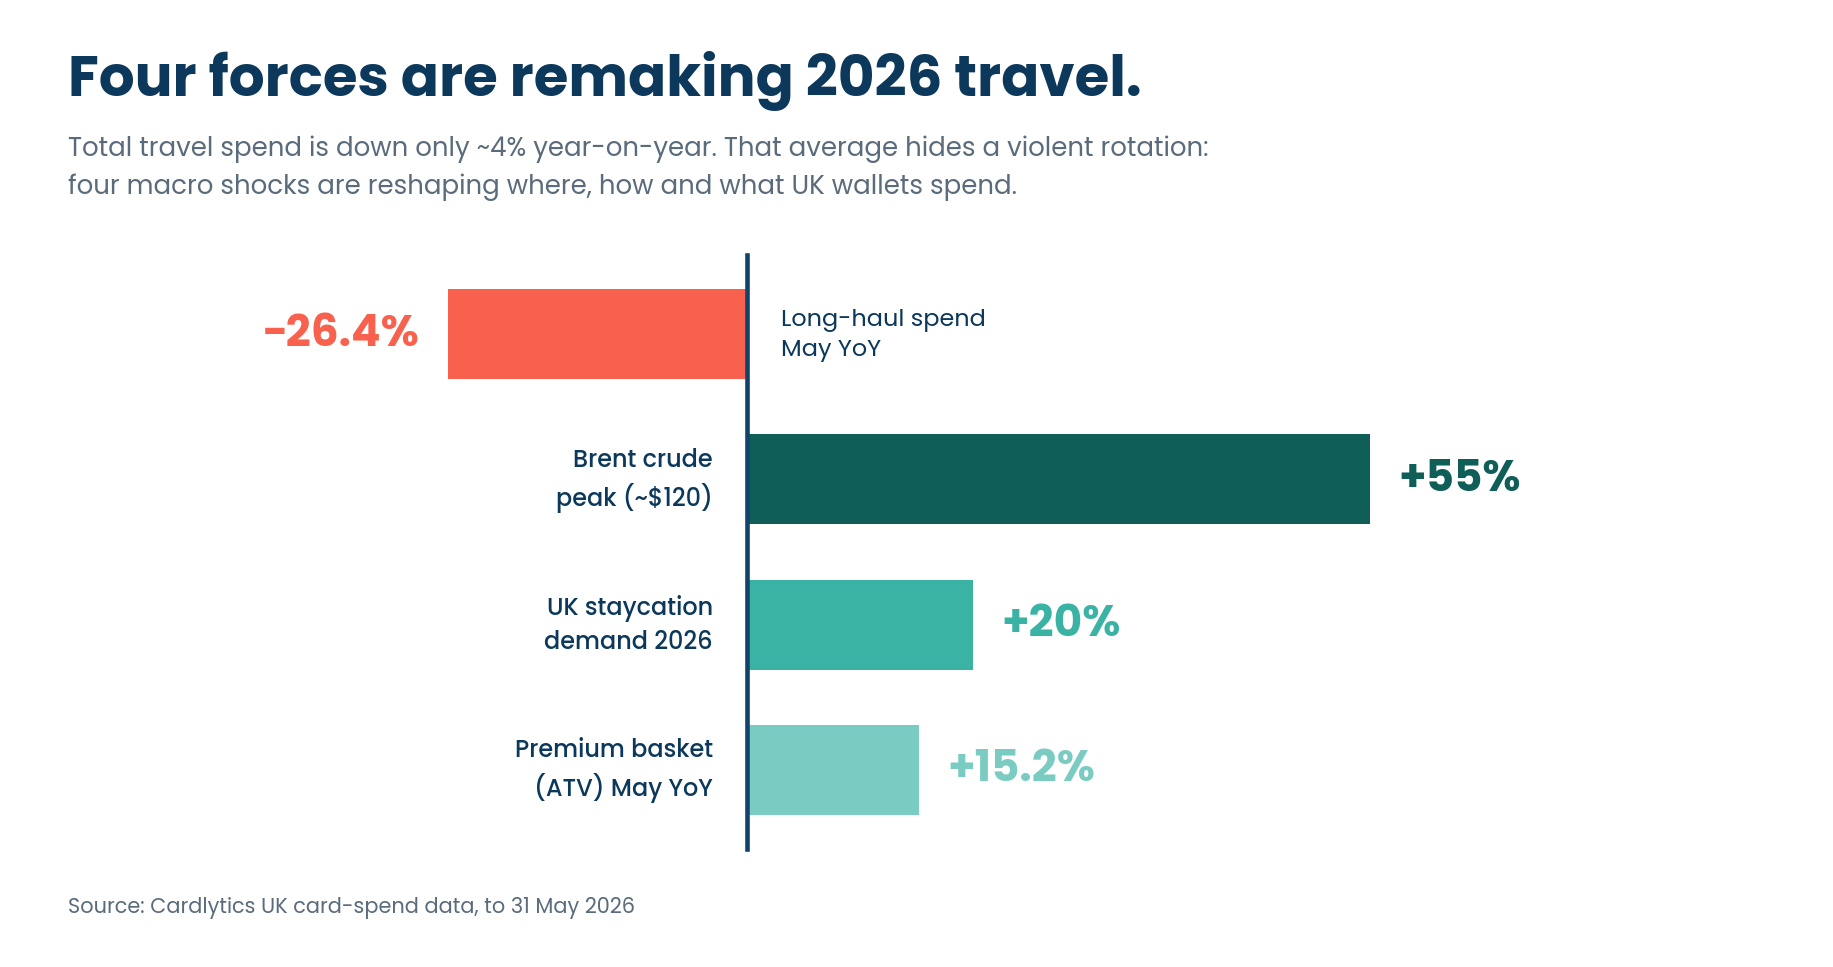
UK travel spend looks steady on the surface — down just ~4% year-on-year. Look closer, and the story isn't decline. It's rotation.
New analysis from Cardlytics, drawing on UK card-spend data to the end of May 2026, shows four macro shocks — the US–Iran conflict, a jet-fuel supply squeeze, a staycation surge, and a resilient premium wallet — quietly redrawing where, how and what UK travellers book.
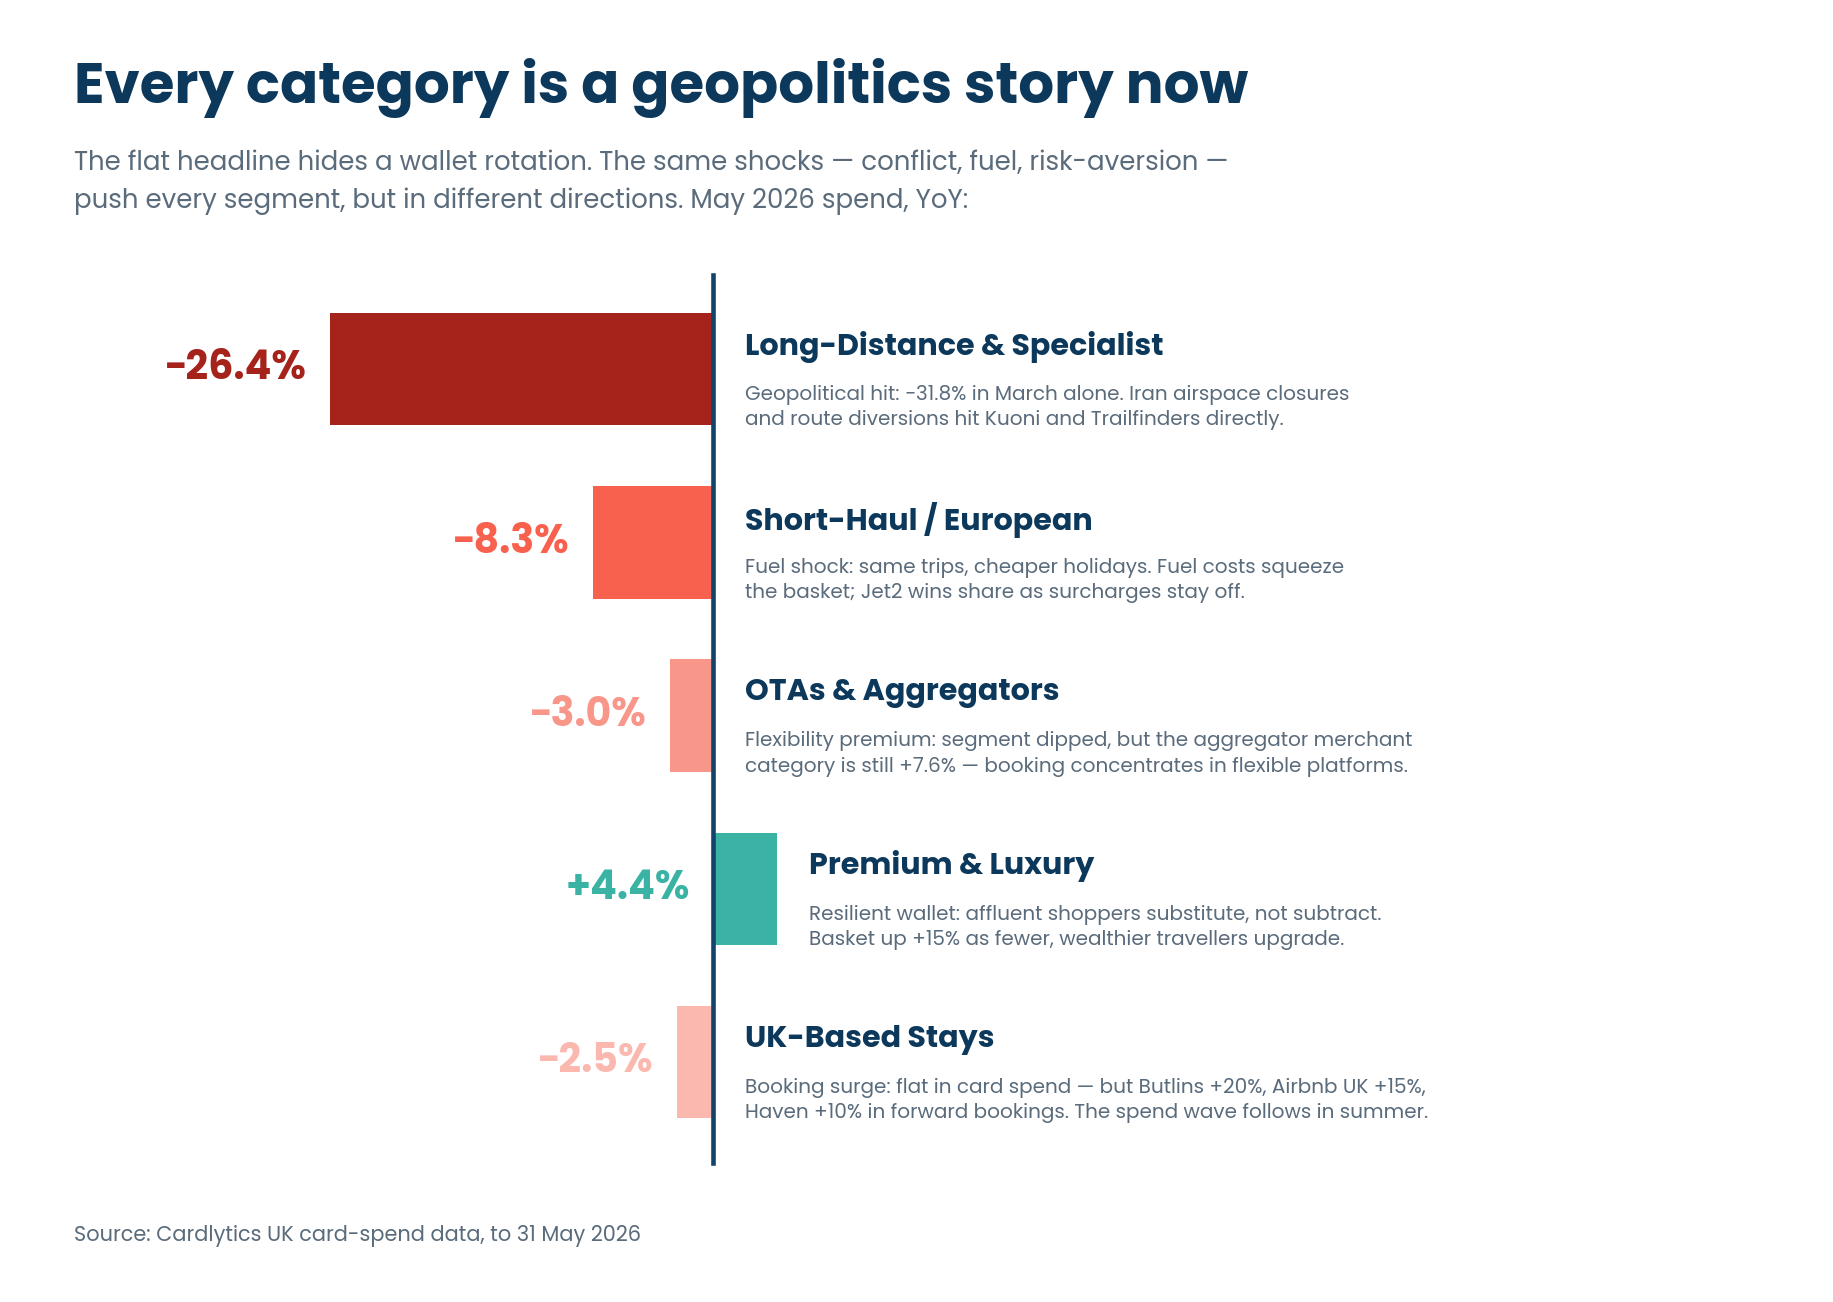
Four shifts travel leaders shouldn't ignore
Long-haul is falling off a cliff. Long-Distance & Specialist spend fell 26.4% in May year-on-year — but trips fell 29.4%. Nearly a third of journeys are gone, and rising ticket values are masking a real, geopolitically-driven pullback.
Booking is moving to the middlemen. The travel aggregators and agencies category grew 7.6% while tour operators fell 10.1% and cruise lines 9.8%. Facing an uncertain
backdrop, consumers are paying a premium for flexibility — booking through platforms they trust to find value and re-route them.
Premium travellers substitute — they don't subtract. Premium & Luxury spend rose 4.4%, with the average basket up 15.2%. Fewer, wealthier travellers are trading up, and luxury domestic stays are absorbing displaced long-haul demand.
The staycation wave hasn't hit the card data yet. UK domestic demand is up around 20% year-on-year, with 46% of Brits citing global conflict as a reason to holiday at home. Forward bookings are surging — the spend wave lands this summer.
Unlock the full State of Spend: Travel Edition
The headline numbers hide the real story: a collapse in long-haul trips, a flight to flexible booking, and a premium wallet that refuses to slow down. Download the full report for the segment-by-segment breakdown and four travel plays for a cautious wallet.
Inside the report:
- The Long-Haul Cliff: why trips fell nearly 40% in March — and what rising
ticket values are hiding. - Same Shift, Five Behaviours: spend decomposed into trips and basket size, from mass desertion to trading up.
- Where Spend Flows: the merchant categories gaining and losing share as booking concentrates with aggregators
- Four Travel Plays: where Card-Linked Offers and Cardlytics Insights should focus for OTAs, long-haul operators, premium brands and short-haul carriers.


Four signals from a shifting wallet — and what they mean for advertisers.
UK consumer spending looks healthy on the surface. Look closer, and the wallet is quietly diverging.
New analysis from Cardlytics, drawing on UK purchase data across more than 60 million enabled accounts, shows positive year-on-year spend growth across every macro category in H1 2026. But transactions, customer counts, and basket sizes tell a very different story underneath.
Consumers are protecting holidays, paying more for fewer nights out, and trading down on the high street.
Three shifts leaders shouldn't ignore
Holidays held, but restaurants didn't. Hospitality lost 3.83% of transactions year-on-year in H1; Nightlife lost 3.95%. Travel grew 0.97% in Q1, with Entertainment & Leisure up 6.16%.
Inflation is doing the heavy lifting on the high street. Hospitality, Nightlife, and Everyday Conveniences all posted positive spend growth — but only because average ticket value rose around 5%. Real visit frequency is falling.
Retail is winning volume and losing value. Non-Essential Retail transactions rose 6.09% in H1 while average basket size fell 4.15%. Consumers are shopping more often and spending less per basket — a clear discount-led signal.
Spend and transactions tell two different stores
Unlock the full Q2 State of Spend report
Top-line growth is masking a structural pullback in mid-week dining, a narrowing active customer base, and a discount-driven retail shift. Download the full report for the category-by-category breakdown and the four advertiser playbooks for an uneven wallet.
Inside the report:
- The "Who Is Losing?" Index: How six macro categories really performed once ATV inflation is stripped out.
- The Hospitality & Nightlife Squeeze: Why footfall is down ~4% even as spend ticks up.
- The Retail Paradox: Record transaction frequency colliding with shrinking baskets.
Four Playbooks for Advertisers: Where to drive frequency, where to grow basket size, and where loyalty beats acquisition in Q3.

From loyalty to relevance: Why personalised rewards matter more than ever for UK banks
UK consumers may feel loyal to their bank, but that loyalty is increasingly conditional.
New research from Cardlytics, based on a nationally representative survey of 4,000 UK adults, shows that while most customers are not actively planning to switch, many are open to reassessing where they bank when the value is clear.
Two thirds of consumers (65%) say they feel loyal to their main bank, and 60% say they are unlikely to switch in the next 12 months. But that stability should not be mistaken for permanence. More than half (57%) have switched their main bank account at some point as an adult, and many now spread their money across more than one provider.
The result is a banking market where retention is no longer just about keeping customers from leaving altogether. It is about staying relevant in more of their everyday financial decisions.
Trust and service still matter, but they are now the baseline
When asked what keeps them with their current bank, UK consumers are most likely to cite good customer service (40%), brand trust and reputation (35%), and the quality of mobile or online banking (32%).
These are the foundations of a strong banking relationship. They help explain why customers stay put, particularly older generations. For example, Baby Boomers are significantly more likely to say customer service is a key reason they stay with their bank (50%).
But these factors are increasingly expected. They are essential to retention, but on their own they may be less effective at creating real competitive advantage.
Unlock the full Cardlytics Banking Index 2026
The shift from passive loyalty to active relevance is changing how the UK banks. To read the full analysis on how financial value triggers action, the impact of personalised rewards on 18 to 34 year olds, and why loyalty is no longer exclusive, download the complete report below.
Get the full insights to discover:
- The Switching Triggers: The specific financial incentives driving 25% of Gen Z to reconsider their bank.
- The Personalisation Opportunity: How tailored rewards can increase retention by up to 55% for key demographics.
- The Visibility Challenge: Why 22% of customers are unaware of the rewards their banks already offer.
- Multi-banking Trends: Why customers are spreading their finances and how to capture a greater share of wallet.
Get in touch
Need additional information or have a question? Tell us a little bit more and we’ll respond shortly.