
Press Releases

Cardlytics Announces Timing of Its Third Quarter 2022 Financial Results Conference Call and Webcast
Atlanta, GA – October 18, 2022 – Cardlytics, Inc., (NASDAQ: CDLX), an advertising platform in banks’ digital channels, today announced that its third quarter ended September 30, 2022 financial results will be released on Tuesday, November 1, 2022, after market close. The company will host a conference call and webcast at 5:00 PM (ET) / 2:00 PM (PT) to discuss the company’s financial results.
A live audio webcast of the event will be available on the Cardlytics Investor Relations website at http://ir.cardlytics.com/. A live dial-in will be available after registering at this link. Shortly after the conclusion of the call, a replay of this conference call will be available through 8:00 PM ET on November 8, 2022 on the Cardlytics Investor Relations website at http://ir.cardlytics.com/.
About Cardlytics
Cardlytics (NASDAQ: CDLX) is a digital advertising platform. We partner with financial institutions to run their rewards programs that promote customer loyalty and deepen relationships. In turn, we have a secure view into where and when consumers are spending their money. We use these insights to help marketers identify, reach, and influence likely buyers at scale, as well as measure the true sales impact of marketing campaigns. Headquartered in Atlanta, Cardlytics has offices in Palo Alto, Los Angeles, New York, and London. Learn more at www.cardlytics.com.
Cardlytics Announces Inducement Grant Under Nasdaq Listing Rule 5635(c)(4)
ATLANTA, GA – January 23, 2023 - Cardlytics (NASDAQ: CDLX), an advertising platform in banks’ digital channels, today announced that Cardlytics’ Board of Directors granted 350,000 restricted stock units of Cardlytics to Amit Gupta, Cardlytics’ newly hired Chief Operating Officer. The foregoing restricted stock units were granted as a material inducement to employment with Cardlytics in accordance with Nasdaq Listing Rule 5635(c)(4) and were granted under the Cardlytics 2022 Inducement Plan (the “2022 Inducement Plan”). 50% of the restricted stock units shall vest on the first anniversary of the grant date and the remaining 50% of the restricted stock units shall vest quarterly over the following year, subject to Gupta’s continuous service with Cardlytics as of each respective vesting date. The restricted stock units are subject to the terms and conditions of the 2022 Inducement Plan.
About Cardlytics
Cardlytics (NASDAQ: CDLX) is a digital advertising platform. We partner with financial institutions to run their banking rewards programs that promote customer loyalty and deepen banking relationships. In turn, we have a secure view into where and when consumers are spending their money. We use these insights to help marketers identify, reach, and influence likely buyers at scale, as well as measure the true sales impact of marketing campaigns. Headquartered in Atlanta, Cardlytics has offices in Palo Alto, Los Angeles, New York, and London. Learn more at www.cardlytics.com.
Contacts:
Public Relations:
Robert Robinson
Investor Relations:
Robert Robinson
Cardlytics Appoints Amit Gupta as Chief Operating Officer
ATLANTA, GA – January 23, 2022 – Cardlytics (NASDAQ: CDLX), an advertising platform in banks’ digital channels, today announced the appointment of Amit Gupta as its Chief Operating Officer, reporting directly to Karim Temsamani, Chief Executive Officer.
Effective today, Gupta will lead Cardlytics’ overall operations, strategy, and business analytics, where he will closely align with sales, product, and engineering leadership to deliver an optimized platform that exceeds both advertiser and partner expectations. In addition, Gupta will serve as the general manager of Bridg, where Cardlytics can leverage his experience running and scaling businesses. Amit Jain, current CEO of Bridg, will work closely with Gupta as he transitions out of the business over the next several months.
“Cardlytics is delighted to have attracted such a thoughtful, experienced and operationally strong executive,” said Temsamani. “Amit and I worked together for several years at Stripe, where he always impressed me with his strategic and technical abilities. I look forward to resuming our partnership as we optimize and grow the potential of the Cardlytics business."
Gupta joins Cardlytics from Stripe where he was Head of Strategy and Operations for Global Partnerships, responsible for work with banks, networks, and payment methods. Before Stripe, Gupta was Director of Strategy, New Products, and Operations for Google’s Geo division, leading product and engineering execution and strategy for popular consumer and business products like Google Maps, Local Search, Food, Maps Enterprise Platform, and SMBs. Prior, Gupta founded and was the CEO of a series of startups. He started his career at Booz Allen Hamilton, where he was promoted to Partner in the Technology practice working with clients across media, financial services, and consumer products.
“I am extremely excited to join the Cardlytics team. My background in both advertising and financial technology gives me a unique perspective on Cardlytics’ current capabilities and future product offerings. The product roadmap ahead makes now the perfect time to focus on operational excellence by optimizing the efficiency of the core platform and unlocking the potential of the promising Bridg business. I’m looking forward to helping the team execute on our goals and harness the full power of the platform in such a pivotal moment,” said Gupta.
Gupta holds a Bachelor of Science, Electrical Engineering from The Ohio State University and a Master of Business Administration from the NYU Stern School of Business. He will be based in Cardlytics’ Palo Alto office.
About Cardlytics
Cardlytics (NASDAQ: CDLX) is a digital advertising platform. We partner with financial institutions to run their banking rewards programs that promote customer loyalty and deepen banking relationships. In turn, we have a secure view into where and when consumers are spending their money. We use these insights to help marketers identify, reach, and influence likely buyers at scale, as well as measure the true sales impact of marketing campaigns. Headquartered in Atlanta, Cardlytics has offices in Palo Alto, New York, Los Angeles, and London. Learn more at www.cardlytics.com.
Cautionary Language Concerning Forward-Looking Statements
This press release contains "forward-looking statements" within the meaning of the "safe harbor" provisions of the Private Securities Litigation Reform Act of 1995, including but not limited to future growth and delivery of an optimized platform. These forward-looking statements are made as of the date they were first issued and were based on current expectations, estimates, forecasts and projections as well as the beliefs and assumptions of management. Words such as "expect," "anticipate," "should," "believe," "hope," "target," "project," "goals," "estimate," "potential," "predict," "may," "will," "might," "could," "intend," or variations of these terms or the negative of these terms and similar expressions are intended to identify these forward-looking statements. Forward-looking statements are subject to a number of risks and uncertainties, many of which involve factors or circumstances that are beyond our control.
Our actual results could differ materially from those stated or implied in forward-looking statements due to a number of factors, including but not limited to the risks detailed in the “Risk Factors” section of our Form 10-Q filed with the Securities and Exchange Commission on November 1, 2022 and in subsequent periodic reports that we file with the Securities and Exchange Commission. Past performance is not necessarily indicative of future results.
The forward-looking statements included in this press release represent our views as of the date of this press release. We anticipate that subsequent events and developments will cause our views to change. We undertake no intention or obligation to update or revise any forward-looking statements, whether as a result of new information, future events or otherwise, except as required by law. These forward-looking statements should not be relied upon as representing our views as of any date subsequent to the date of this press release.
Contacts:
Public Relations:
Robert Robinson
Investor Relations:
Robert Robinson
Cardlytics Announces Third Quarter 2022 Financial Results
Atlanta, GA – November 1, 2022 – Cardlytics, Inc. (NASDAQ: CDLX), a digital advertising platform, today announced financial results for the third quarter ended September 30, 2022. Supplemental information is available on the Investor Relations section of Cardlytics' website at http://ir.cardlytics.com/.
“We delivered solid double-digit growth despite the serious challenges present in the economy,” said Karim Temsamani, CEO of Cardlytics. “While the economy may be uncertain, I believe there is inherent resiliency in platforms that prove return on ad spend, and I am positive that we can grow profitably. There is a large opportunity ahead of us, and we will be disciplined in Q4 and beyond as we prioritize our goals and position the company well for the next ten years.”
“Our results this quarter were in line with our expectations given our clients' concerns about the economy,” said Andy Christiansen, CFO of Cardlytics. “There is a wide range of outcomes for Q4, but our highest priority is meeting our profitability and cash flow goals for 2023. We are focused on taking the necessary steps to ensure we can control our destiny and achieve our long-term goals.”
Third Quarter 2022 Financial Results
- Revenue was $72.7 million, an increase of 12% year-over-year, compared to $65.0 million in the third quarter of 2021.
- Billings, a non-GAAP metric, was $110.4 million, an increase of 12% year-over-year, compared to $98.4 million in the third quarter of 2021.
- Gross profit was $26.0 million, an increase of 6% year-over-year, compared to $24.5 million in the third quarter of 2021.
- Adjusted contribution, a non-GAAP metric, was $35.1 million, an increase of 11% year-over-year, compared to $31.6 million in the third quarter of 2021.
- Net income attributable to common stockholders was $6.3 million, or $0.19 per diluted share, based on 33.3 million fully diluted weighted-average common shares, compared to a net loss attributable to common stockholders of $(44.5) million, or $(1.35) per diluted share, based on 33.1 million fully diluted weighted-average common shares in the third quarter of 2021.
- Non-GAAP net loss was $(16.5) million, or $(0.50) per diluted share, based on 33.3 million fully diluted weighted-average common shares, compared to non-GAAP net loss of $(11.0) million, or $(0.33) per diluted share, based on 33.1 million fully diluted weighted-average common shares in the third quarter of 2021.
- Adjusted EBITDA, a non-GAAP metric, was a loss of $(12.7) million compared to a loss of $(5.2) million in the third quarter of 2021.
Key Metrics
- Cardlytics MAUs were 184.7 million, an increase of 8%, compared to 170.6 million in the third quarter of 2021.
- Cardlytics ARPU was $0.36 in the third quarter of 2022 and 2021.
- Bridg ARR was $22.1 million in the third quarter of 2022.
Definitions of MAUs, ARPU and ARR are included below under the caption “Non-GAAP Measures and Other Performance Metrics."
Fourth Quarter 2022 Financial Expectations
Cardlytics anticipates billings, revenue, and adjusted contribution to be in the following ranges (in millions):
Q4 2022 GuidanceBillings(1)$120.0 - $132.0Revenue$80.0 - $90.0Adjusted contribution(2)$38.0 - $44.0
- A reconciliation of billings to GAAP revenue on a forward-looking basis is presented below under the heading "Reconciliation of Forecasted GAAP Revenue to Billings."
- A reconciliation of adjusted contribution to GAAP gross profit on a forward-looking basis is not available without unreasonable efforts due to the high variability, complexity and low visibility with respect to the items excluded from this non-GAAP measure.
Earnings Teleconference Information
Cardlytics will discuss its third quarter 2022 financial results during a teleconference today, November 1, 2022, at 5:00 PM ET / 2:00 PM PT. A live dial-in will be available after registering at http://ir.cardlytics.com/. Shortly after the conclusion of the call, a replay of this conference call will be available through 8:00 PM ET on November 8, 2022 on the Cardlytics Investor Relations website at http://ir.cardlytics.com/. Following the completion of the call, a recorded replay of the webcast will be available on Cardlytics’ website.
About Cardlytics
Cardlytics (NASDAQ: CDLX) is a digital advertising platform. We partner with financial institutions to run their rewards programs that promote customer loyalty and deepen relationships. In turn, we have a secure view into where and when consumers are spending their money. We use these insights to help marketers identify, reach, and influence likely buyers at scale, as well as measure the true sales impact of marketing campaigns. Headquartered in Atlanta, Cardlytics has offices in London, New York, Los Angeles, San Francisco, Austin, Detroit and Visakhapatnam. Learn more at www.cardlytics.com.
Cardlytics’ Back-to-School Trend Analysis Shows Impact of Omnichannel on Consumer Spend and Retention
Analysis offers insight from previous back-to-school seasons ahead of the second-largest shopping event of the year
ATLANTA – August 1, 2022 – Cardlytics (NASDAQ: CDLX) released its annual back-to-school (BTS) trend analysis, which underscores the importance of providing consumers with an omnichannel shopping experience to maximize consumer loyalty. The analysis, which comes as 62 percent of consumers start their back-to-school shopping this month, examines previous BTS spending behaviors for a sense of what to expect during the 2022 BTS shopping season amid the backdrop of rising inflation.
Key Takeaway
Notably, the analysis found that consumers who shop across channels (e.g., in-store, online, apps, etc.) spend more. In 2021, shoppers using just one channel spent an average of $900 during the back-to-school shopping season, but those who purchased items across multiple channels spent over $1,000. Even as customers spent more across both on and offline channels in 2022, in-store shopping remains the preferred method for most. It also shows that in-store sales are slowly returning to pre-COVID levels at 63 percent of total spend in 2021, compared to 61 percent in 2020, and 73 percent in 2019.
As shoppers gear up for the 2022 season, inflation may drive these figures higher due to spend per purchase, but that does not necessarily equate to increased purchases in any given category. Cardlytics’ Q1 2022 State of Spend report saw a slowdown in spending toward the end of Q1 as consumers made adjustments to accommodate increased costs in goods, food, gas, and housing brought on by the highest inflation seen since the 1980s. This could continue into the BTS and holiday 2022 seasons as customers focus on purchasing essentials and possibly engage in more one-stop shopping.
“Convincing your customers to convert on both online and offline channels is essential to maximizing incremental sales and customer loyalty,” said Nate Bucholz, Cardlytics’ vice president of DTC, Subscription, and Retail. “Our insights continue to show that people shopping across a brand’s available channels spend more than those who shop in only one channel. And they are more likely to return. Looking at your customer base through the lens of the channel they shop can help you get the most impact from your marketing spend. I would encourage brands to offer the best sales and cashback rewards now to acquire and retain customers as they head into the holidays, which is the last big shopping season of the year.”

Click here or on the image above to open the full-size infographic in a new window.
Additional Trend Highlights
The back-to-school season is the second largest shopping event of the year behind the December holiday season, making up 15 percent of annual consumer spending. The analysis includes sales for apparel, home décor, office supplies, sporting goods, shoes, and mass merchandiser, finding that:
- Overall spend was flat with only a 1.2 percent increase between 2020 and 2021. This is likely due to declines in customer volume and total purchases – defined as the number of actual customers making purchases in these categories. This trend may continue through the 2022 BTS season with minimal growth as customers tighten their wallets and only increase their spending in response to increased prices.
- Apparel had a strong 2021 back-to-school season as parents rushed to refresh wardrobes for in-person schooling. The data showed that spend increased by 24.3 percent year-over-year in this category, driven by strong customer and purchase growth. Spend increases in this category were due to genuine growth and are not a byproduct of current inflation. It is predicted that due to tightening economic conditions and the fact that people spent significantly more last year than the year before, it is likely that there will be a flat or negative spend growth for 2022.
- Shoes and children’s apparel saw significant increases as well last year. Shoes had a nearly 30 percent year-over-year increase while children’s apparel saw a 13.2 percent jump. But, shoe companies are bracing for weaker sales for the latter half of this year, which could impact overall growth for this category in 2022.
- Consumers cut back on home and office supplies in 2021, and this trend has a strong chance of continuing as more children return to classrooms in 2022. Home and office supply spending was down 8 and 8.8 percent, respectively, as fewer purchases were needed for homeschooling and to counterbalance heavy spending in previous years.
- Department stores also experienced greater sales with increases across volume of shoppers, number of purchases, and spend per purchase. Year-over-year spend went up by 22.4 percent. Spending in this category may also feel the impact of inflation, particularly when it comes to spend per purchase – while consumers may have less items in their cart, this may be offset by increased costs for each item.
The review covers an eight-week period beginning the second weekend of July and lasting through Labor Day. Early insights from the first two weeks of July 2022 show that spend is down 8.4 percent YoY as customers brace for economic uncertainty. This points to a decline in the number of customers and purchases resulting in a sluggish start this season across all categories. To view the full trend analysis, visit: https://www.cardlytics.com/blog/customer-loyalty-is-the-battleground-for-back-to-school/
About Cardlytics
Cardlytics (NASDAQ: CDLX) is a digital advertising platform. We partner with financial institutions to run their rewards programs that promote customer loyalty and deepen relationships. In turn, we have a secure view into where and when consumers are spending their money. We use these insights to help marketers identify, reach, and influence likely buyers at scale, as well as measure the true sales impact of marketing campaigns. Headquartered in Atlanta, Cardlytics has offices in London, New York, Los Angeles, San Francisco, Austin, Detroit, and Visakhapatnam. Learn more at www.cardlytics.com.
<strong>Cardlytics Announces Second Quarter 2022 Financial Results</strong>
Atlanta, GA – August 2, 2022 – Cardlytics, Inc. (NASDAQ: CDLX), a digital advertising platform, today announced financial results for the second quarter ended June 30, 2022. Supplemental information is available on the Investor Relations section of Cardlytics' website at ir.cardlytics.com.
“I am pleased with our growth in the first half of the year despite the growing pressure macro conditions are having on consumer spending and ad budgets,” said Lynne Laube, CEO & Co-Founder of Cardlytics. “We are also pleased with the progress we are seeing in the Bridg acquisition and expect to see further proof points in future quarters. The combination of the Cardlytics and Bridg data sets has us on the cusp of being able to scale the business beyond our core platform, while our focus on financial goals will allow us to control our own destiny moving forward.”
“We are committed to meeting our adjusted EBITDA and free cash flow goals in 2023, and we’re taking several proactive steps to reduce our cost structure in recognition of the lower-growth environment we are entering,” said Andy Christiansen, CFO of Cardlytics. “We expect year-over-year growth of approximately 10 to 15% in the back half of 2022, and I believe we can navigate a lower growth environment with minimal impact on the long-term prospects of the business.”
Second Quarter 2022 Financial Results
- Revenue was $75.4 million, an increase of 28% year-over-year, compared to $58.9 million in the second quarter of 2021.
- Billings, a non-GAAP metric, was $107.7 million, an increase of 26% year-over-year, compared to $85.3 million in the second quarter of 2021.
- Gross profit was $27.0 million, an increase of 16% year-over-year, compared to $23.2 million in the second quarter of 2021.
- Adjusted contribution, a non-GAAP metric, was $35.1 million, an increase of 19% year-over-year, compared to $29.6 million in the second quarter of 2021.
- Net loss attributable to common stockholders was $(126.3) million, or $(3.75) per diluted share, based on 33.6 million fully diluted weighted-average common shares, compared to a net loss attributable to common stockholders of $(47.3) million, or $(1.43) per diluted share, based on 33.0 million fully diluted weighted-average common shares in the second quarter of 2021.
- Non-GAAP net loss was $(21.7) million, or $(0.65) per diluted share, based on 33.6 million fully diluted weighted-average common shares, compared to non-GAAP net loss of $(12.8) million, or $(0.39) per diluted share, based on 33.0 million fully diluted weighted-average common shares in the second quarter of 2021.
- Adjusted EBITDA, a non-GAAP metric, was a loss of $(15.8) million compared to a loss of $(5.7) million in the second quarter of 2021.
Key Metrics
- Cardlytics MAUs were 179.9 million, an increase of 7%, compared to 167.6 million in the second quarter of 2021.
- Cardlytics ARPU was $0.38, an increase of 12%, compared to $0.34 in the second quarter of 2021.
- Bridg ARR was $21.8 million in the second quarter of 2022.
Definitions of MAUs, ARPU and ARR are included below under the caption “Non-GAAP Measures and Other Performance Metrics.
Earnings Teleconference Information
Cardlytics will discuss its second quarter 2022 financial results during a teleconference today, August 2, 2022, at 5:00 PM ET / 2:00 PM PT. A live dial-in will be available after registering at this link. Shortly after the conclusion of the call, a replay of this conference call will be available through 8:00 PM ET on August 9, 2022 on the Cardlytics Investor Relations website at ir.cardlytics.com. Following the completion of the call, a recorded replay of the webcast will be available on Cardlytics’ website.
About Cardlytics
Cardlytics (NASDAQ: CDLX) is a digital advertising platform. We partner with financial institutions to run their rewards programs that promote customer loyalty and deepen relationships. In turn, we have a secure view into where and when consumers are spending their money. We use these insights to help marketers identify, reach, and influence likely buyers at scale, as well as measure the true sales impact of marketing campaigns. Headquartered in Atlanta, Cardlytics has offices in London, New York, Los Angeles, San Francisco, Austin, Detroit and Visakhapatnam. Learn more at www.cardlytics.com.
Research & Insights
View all


What UK travellers did in the first five months of 2026 — and what the data predicts for the rest of the year.
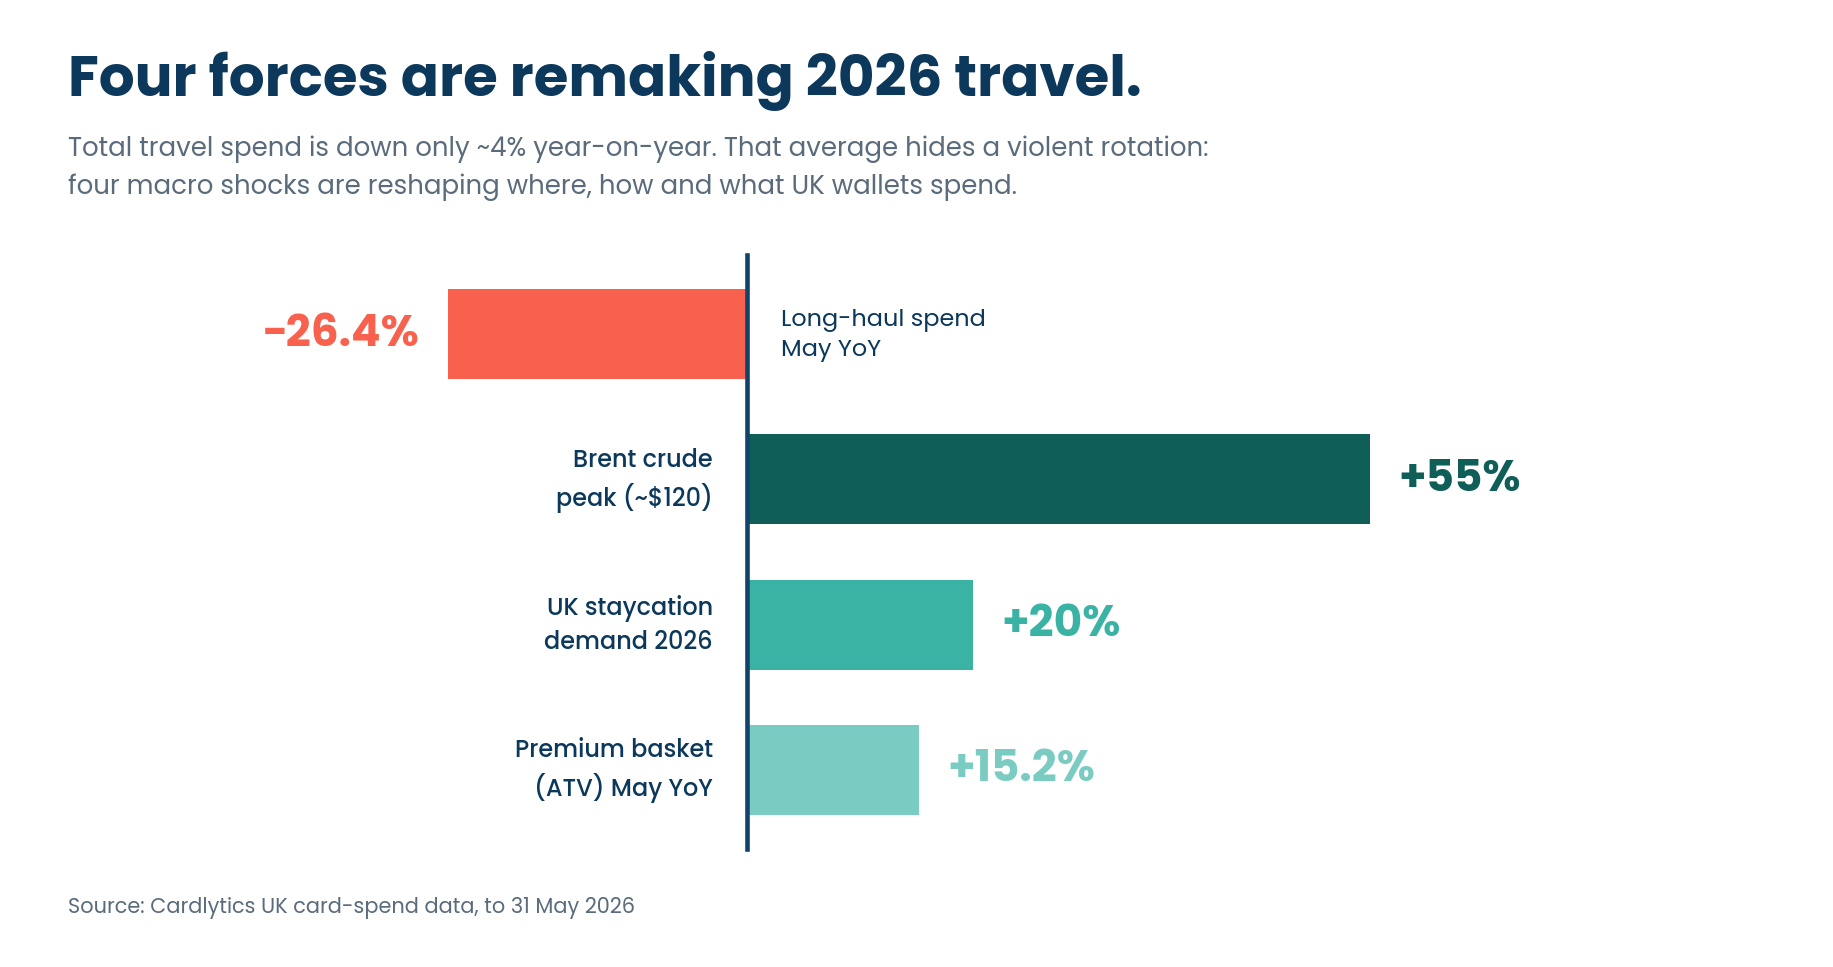
UK travel spend looks steady on the surface — down just ~4% year-on-year. Look closer, and the story isn't decline. It's rotation.
New analysis from Cardlytics, drawing on UK card-spend data to the end of May 2026, shows four macro shocks — the US–Iran conflict, a jet-fuel supply squeeze, a staycation surge, and a resilient premium wallet — quietly redrawing where, how and what UK travellers book.
Four shifts travel leaders shouldn't ignore
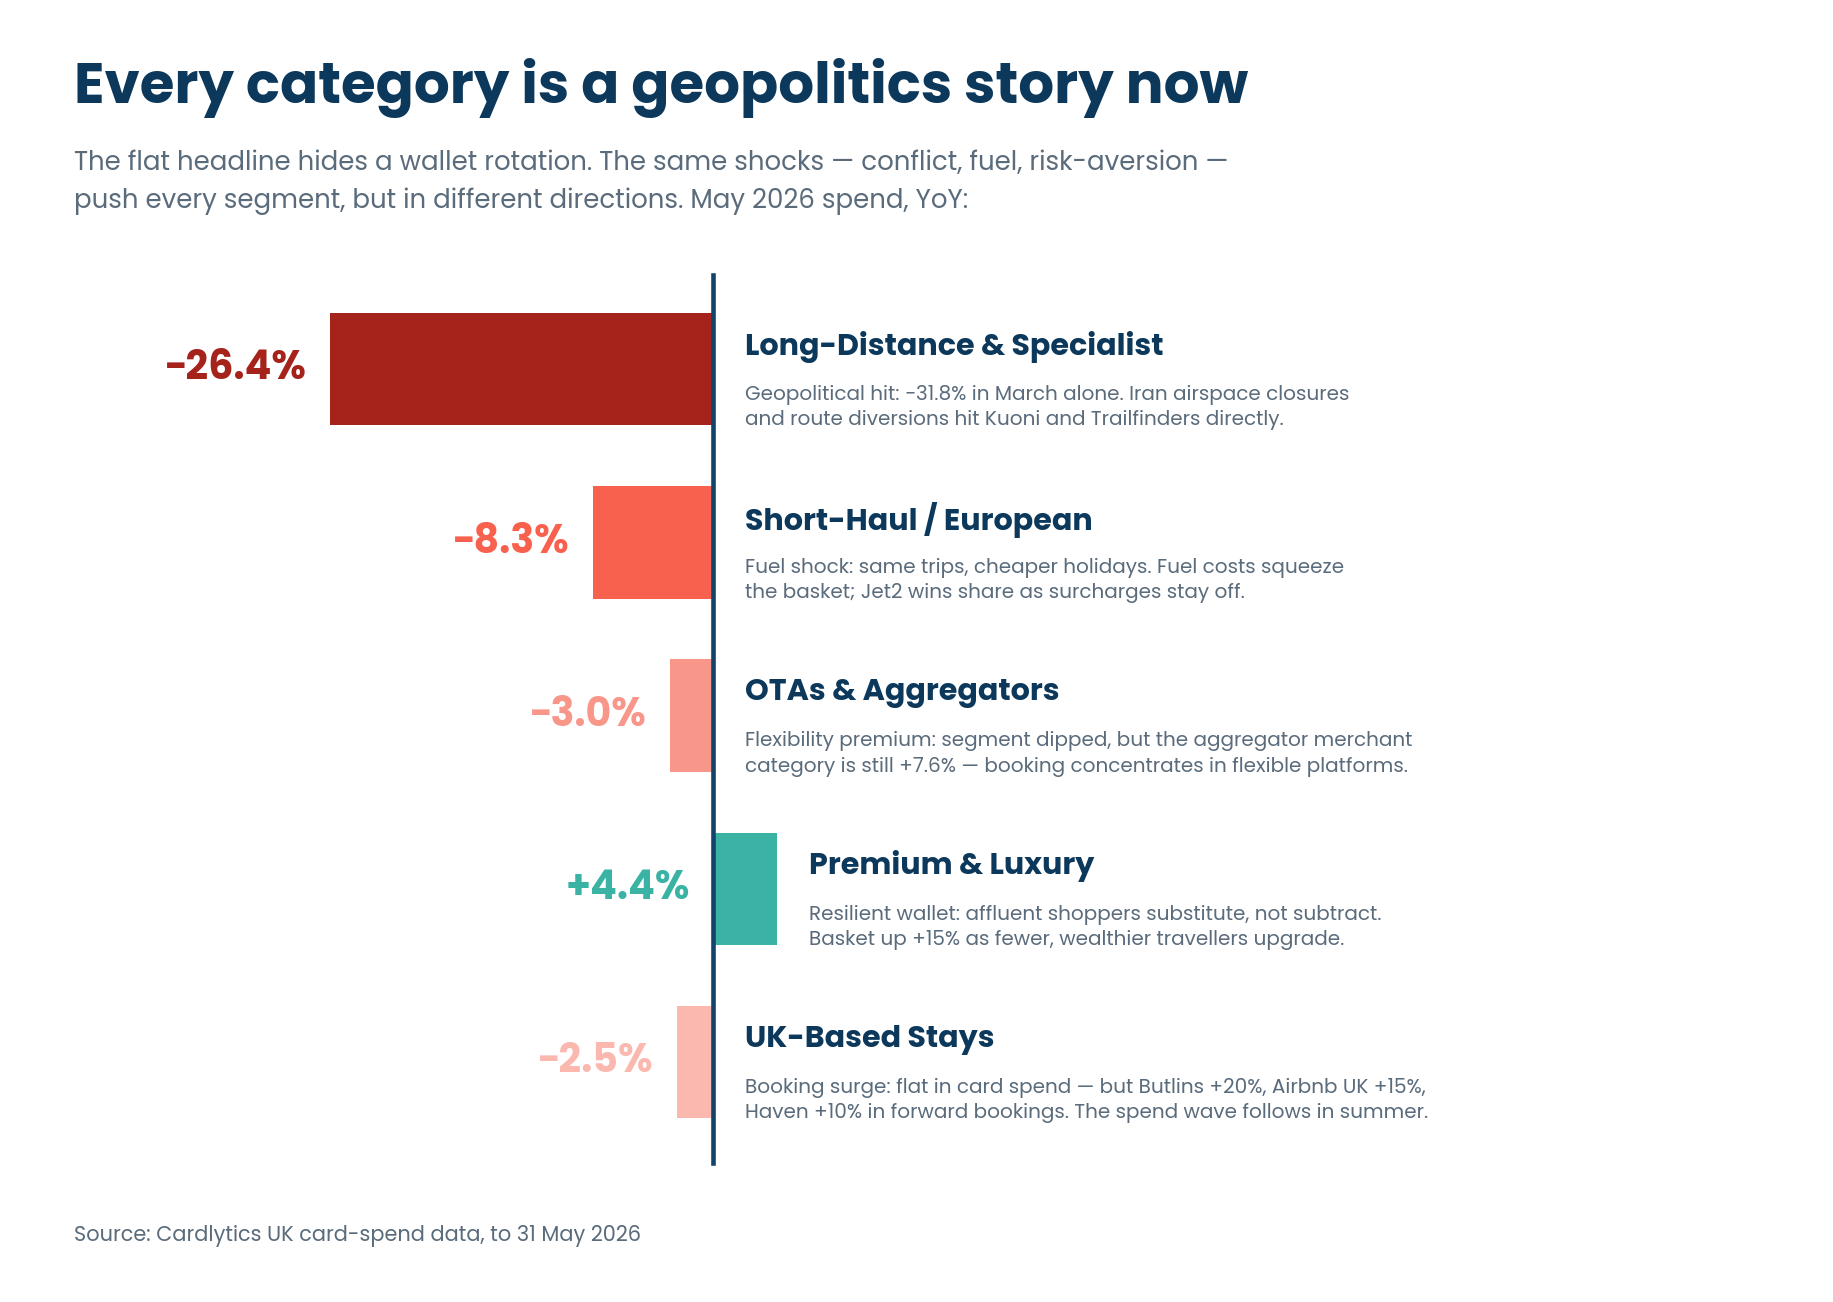
Long-haul is falling off a cliff. Long-Distance & Specialist spend fell 26.4% in May year-on-year — but trips fell 29.4%. Nearly a third of journeys are gone, and rising ticket values are masking a real, geopolitically-driven pullback.
Booking is moving to the middlemen. The travel aggregators and agencies category grew 7.6% while tour operators fell 10.1% and cruise lines 9.8%. Facing an uncertain
backdrop, consumers are paying a premium for flexibility — booking through platforms they trust to find value and re-route them.
Premium travellers substitute — they don't subtract. Premium & Luxury spend rose 4.4%, with the average basket up 15.2%. Fewer, wealthier travellers are trading up, and luxury domestic stays are absorbing displaced long-haul demand.
The staycation wave hasn't hit the card data yet. UK domestic demand is up around 20% year-on-year, with 46% of Brits citing global conflict as a reason to holiday at home. Forward bookings are surging — the spend wave lands this summer.
Unlock the full State of Spend: Travel Edition
The headline numbers hide the real story: a collapse in long-haul trips, a flight to flexible booking, and a premium wallet that refuses to slow down. Download the full report for the segment-by-segment breakdown and four travel plays for a cautious wallet.
Inside the report:
- The Long-Haul Cliff: why trips fell nearly 40% in March — and what rising
ticket values are hiding. - Same Shift, Five Behaviours: spend decomposed into trips and basket size, from mass desertion to trading up.
- Where Spend Flows: the merchant categories gaining and losing share as booking concentrates with aggregators
- Four Travel Plays: where Card-Linked Offers and Cardlytics Insights should focus for OTAs, long-haul operators, premium brands and short-haul carriers.


Four signals from a shifting wallet — and what they mean for advertisers.
UK consumer spending looks healthy on the surface. Look closer, and the wallet is quietly diverging.
New analysis from Cardlytics, drawing on UK purchase data across more than 60 million enabled accounts, shows positive year-on-year spend growth across every macro category in H1 2026. But transactions, customer counts, and basket sizes tell a very different story underneath.
Consumers are protecting holidays, paying more for fewer nights out, and trading down on the high street.
Three shifts leaders shouldn't ignore
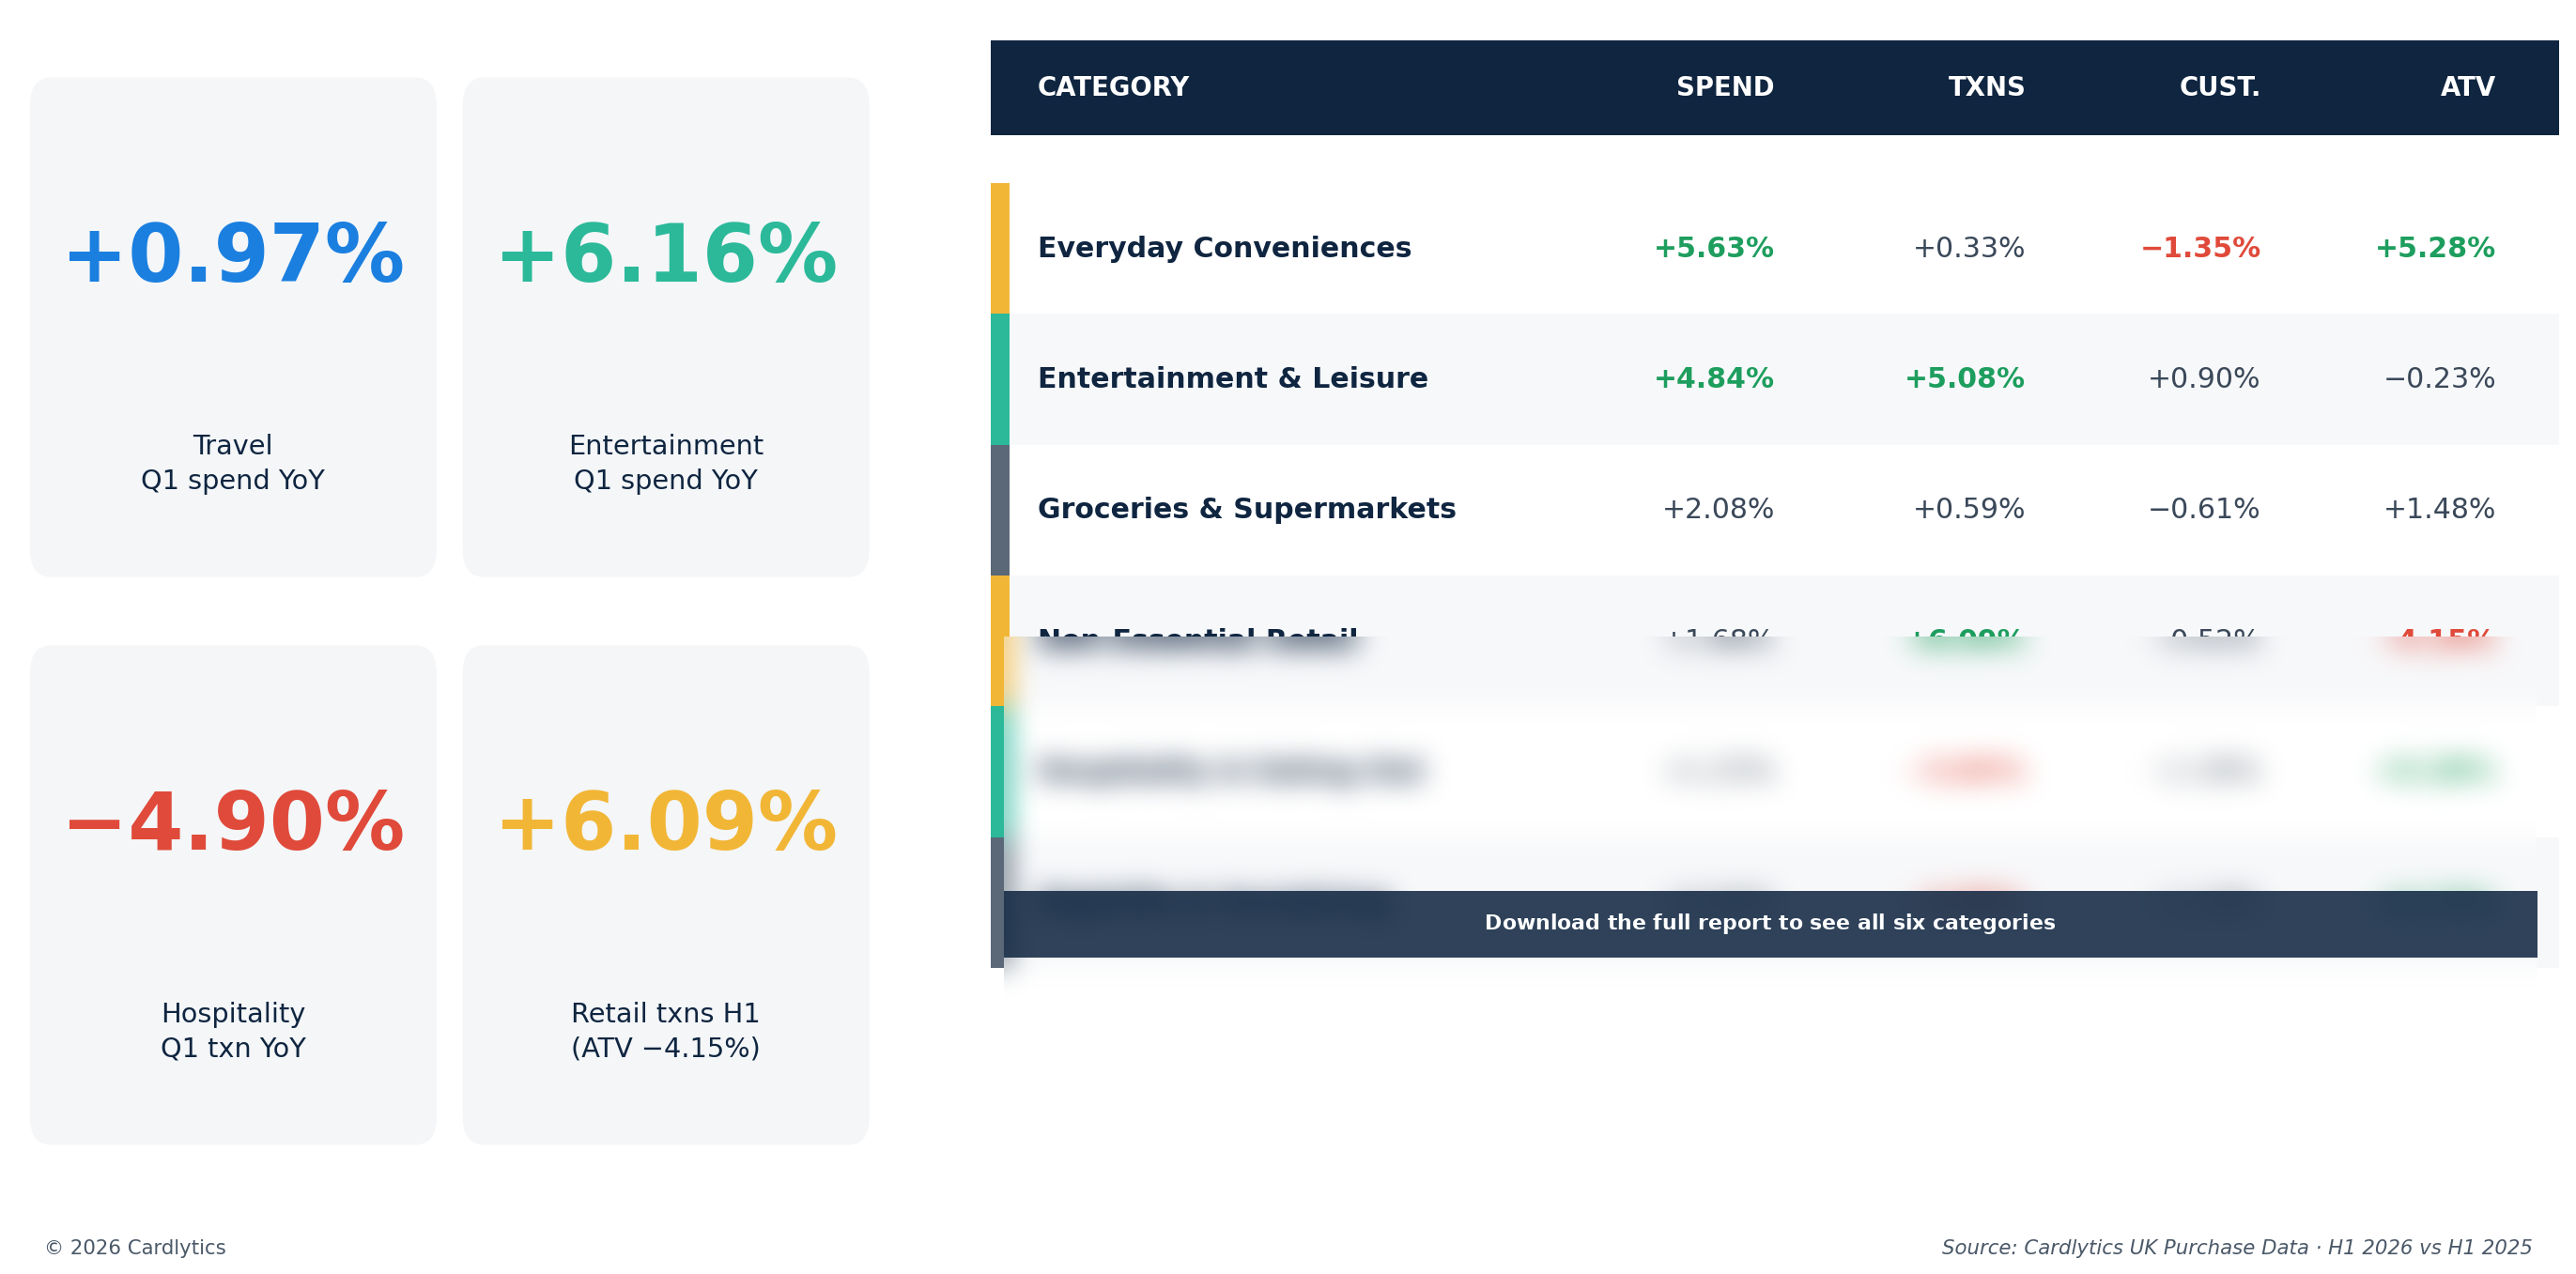
Holidays held, but restaurants didn't. Hospitality lost 3.83% of transactions year-on-year in H1; Nightlife lost 3.95%. Travel grew 0.97% in Q1, with Entertainment & Leisure up 6.16%.
Inflation is doing the heavy lifting on the high street. Hospitality, Nightlife, and Everyday Conveniences all posted positive spend growth — but only because average ticket value rose around 5%. Real visit frequency is falling.
Retail is winning volume and losing value. Non-Essential Retail transactions rose 6.09% in H1 while average basket size fell 4.15%. Consumers are shopping more often and spending less per basket — a clear discount-led signal.
Spend and transactions tell two different stores
Unlock the full Q2 State of Spend report
Top-line growth is masking a structural pullback in mid-week dining, a narrowing active customer base, and a discount-driven retail shift. Download the full report for the category-by-category breakdown and the four advertiser playbooks for an uneven wallet.
Inside the report:
- The "Who Is Losing?" Index: How six macro categories really performed once ATV inflation is stripped out.
- The Hospitality & Nightlife Squeeze: Why footfall is down ~4% even as spend ticks up.
- The Retail Paradox: Record transaction frequency colliding with shrinking baskets.
Four Playbooks for Advertisers: Where to drive frequency, where to grow basket size, and where loyalty beats acquisition in Q3.

From loyalty to relevance: Why personalised rewards matter more than ever for UK banks
UK consumers may feel loyal to their bank, but that loyalty is increasingly conditional.
New research from Cardlytics, based on a nationally representative survey of 4,000 UK adults, shows that while most customers are not actively planning to switch, many are open to reassessing where they bank when the value is clear.
Two thirds of consumers (65%) say they feel loyal to their main bank, and 60% say they are unlikely to switch in the next 12 months. But that stability should not be mistaken for permanence. More than half (57%) have switched their main bank account at some point as an adult, and many now spread their money across more than one provider.
The result is a banking market where retention is no longer just about keeping customers from leaving altogether. It is about staying relevant in more of their everyday financial decisions.
Trust and service still matter, but they are now the baseline
When asked what keeps them with their current bank, UK consumers are most likely to cite good customer service (40%), brand trust and reputation (35%), and the quality of mobile or online banking (32%).
These are the foundations of a strong banking relationship. They help explain why customers stay put, particularly older generations. For example, Baby Boomers are significantly more likely to say customer service is a key reason they stay with their bank (50%).
But these factors are increasingly expected. They are essential to retention, but on their own they may be less effective at creating real competitive advantage.
Unlock the full Cardlytics Banking Index 2026
The shift from passive loyalty to active relevance is changing how the UK banks. To read the full analysis on how financial value triggers action, the impact of personalised rewards on 18 to 34 year olds, and why loyalty is no longer exclusive, download the complete report below.
Get the full insights to discover:
- The Switching Triggers: The specific financial incentives driving 25% of Gen Z to reconsider their bank.
- The Personalisation Opportunity: How tailored rewards can increase retention by up to 55% for key demographics.
- The Visibility Challenge: Why 22% of customers are unaware of the rewards their banks already offer.
- Multi-banking Trends: Why customers are spreading their finances and how to capture a greater share of wallet.